
The AI Benchmark Decoder: What the New Charts Hide
AI companies love to show off colorful charts and massive scores. But logarithmic scales, hidden costs, and cherry-picked data mean these charts often hide the truth. Here is how to read them.
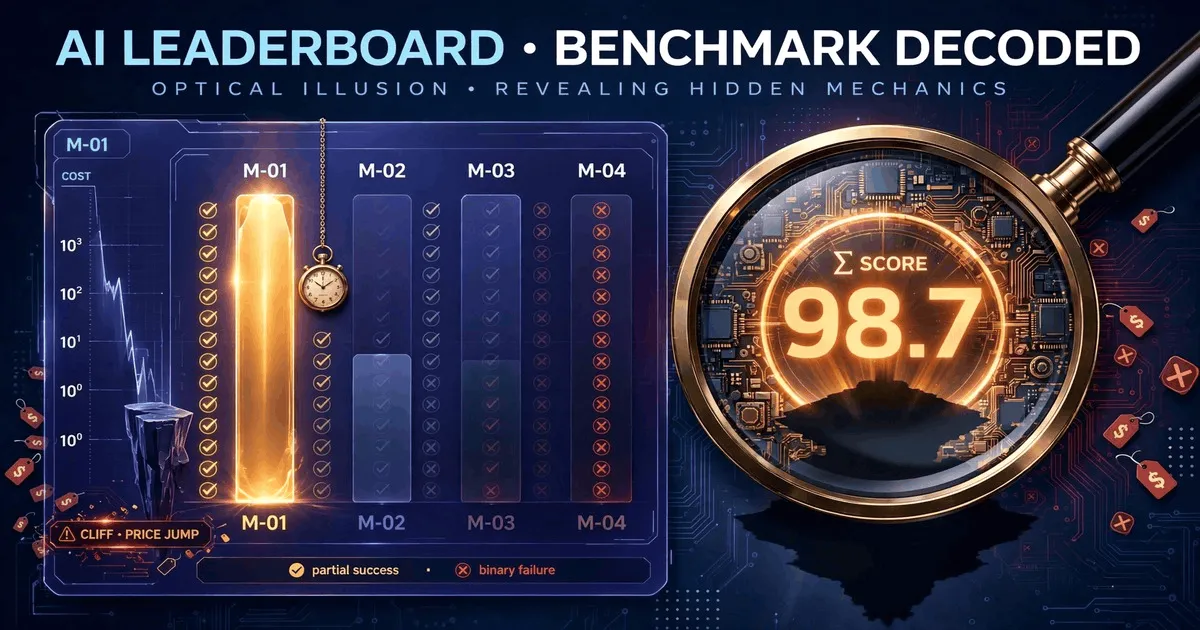
Every month, a major AI lab releases a new model. And every month, that release is accompanied by a press release featuring colorful charts, massive numbers, and claims of “state-of-the-art” performance.
For developers, founders, and product managers, these charts are supposed to be the compass. They are supposed to tell you which model to use.
But they don’t.
Modern AI benchmark charts are designed to impress, not to inform. They use specific visual tricks, hidden math, and selective data to make every new model look like a massive leap forward. If you want to make the right engineering decision, you need to know how to decode them. But before we look at the visual tricks, it helps to understand the deeper structural flaws in how these tests are built. (You can read our full analysis on why most AI benchmarks are misleading).
Here are the four biggest tricks hidden in the new generation of AI benchmark charts, and how to look past them.
Trick 1 — The “Magic Number” Illusion
When a new model is released, the first thing you see is a single, giant number. It might be called “Intelligence Index,” “Overall Score,” or “Capability Rating.”
Take a look at a recent chart from a major benchmarking site:
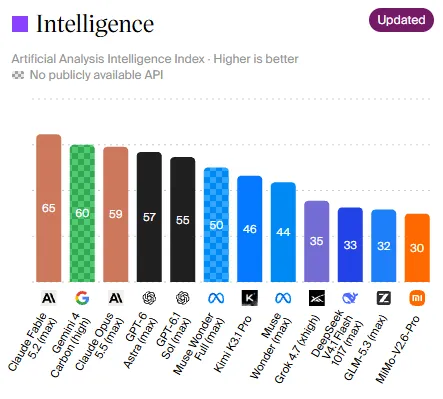
At a glance, it looks like Claude Fable 5.2 (65) and Gemini 4 Carbon (60) are the “smartest” models, while models like MiMo-V2.6-Pro (30) are left in the dust.
Why this is misleading: A single composite score is an average of dozens of different tests (math, coding, reasoning, writing). The AI that scores a 65 might be incredible at coding but terrible at data analysis. The AI that scores a 30 might be much worse at complex reasoning, but might be perfectly adequate at extracting data from invoices, and it might cost 100 times less.
When you look at a single number, you lose the nuance. You start deploying a supercomputer to do the job of a calculator.
Trick 2 — The Logarithmic Axis Illusion
If you look at a chart plotting “Intelligence vs. Cost,” you will often see that the cost axis (X-axis) is using a logarithmic scale.
This is a mathematical trick used to fit very cheap models and very expensive models on the same screen. The problem is that human brains do not think logarithmically.
On a logarithmic chart, the distance between $0.03 and $0.10 looks almost identical to the distance between $0.10 and $1.00. But $0.10 is three times more expensive than $0.03, while $1.00 is ten times more expensive than $0.10.
When a company plots their new model on a log scale, they are visually minimizing the massive gap between a budget model and a premium model. They want you to think, “The cost difference is just a tiny bit to the right,” when in reality, it is a cliff.
Trick 3 — The Time Paradox (The Smartest is the Slowest)
We are taught to believe that “smarter” is always better. But in production, “smarter” often means “slower.”
Look at this chart showing the Time per Task (how many minutes it takes a model to complete a benchmark task):
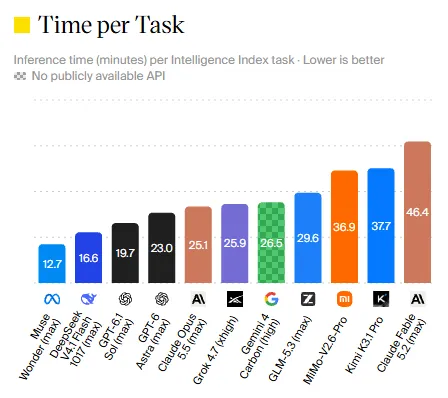
Notice that Claude Fable 5.2 takes the longest time (46.4 minutes per task). Why? Because it uses a massive “chain of thought” to reason through the problem. Meanwhile, Muse Wonder 1.0 finishes the task in just 12.7 minutes.
If you are building a customer support chatbot, a 46-minute response time is useless, no matter how “intelligent” the model is. Yet most release charts bury latency (time) at the bottom, focusing only on the intelligence score. If a model is too slow to use, its intelligence is irrelevant.
Trick 4 — The 100x Cost Gap (And Sticker Price Lies)
Let’s look at the most important chart: Cost per Task.
Benchmarking sites have started calculating how much it actually costs to run one of their benchmark tasks. This is a great step forward, but it reveals a terrifying gap:
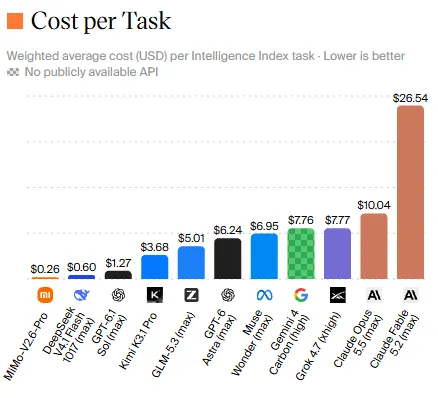
The cheapest model here (Mimo-V2.6-Pro) costs $0.26 per task. The most expensive (Claude Fable 5.2) costs $26.54 per task. That is a 100x difference.
But wait, there is another hidden problem: Sticker Price vs. Real Price. Benchmark sites often calculate this cost using the official API pricing (the “sticker price”) published by OpenAI or Anthropic. But real users rarely pay the sticker price. They use caching, they use third-party providers (like OpenRouter), or they use batch processing.
A model might look expensive on the chart, but if its cache hit rate is high, your actual bill could be 80% lower. Conversely, a cheap model might require three retries (the “Retry Tax”), making it more expensive in reality than the premium model. (To understand the math behind this, read our full guide on** who gets the job done at a lower cost)
The Technical Confusion: Partial vs. Binary
If you look closely at the detailed tables (like the one above), you will see scores with labels like (partial) and (binary).
For example, in OSWorld 2.1 (a test of how well an AI uses a computer desktop), Muse Ember scores 69.5 (partial) but only 33.8 (binary).
What does this mean?
- Partial means the AI successfully did some steps (e.g., it opened the browser, clicked the right link, but failed to download the file).
- Binary means it gets a 1 only if it completes the entire task perfectly.
A model that scores high on partial completion but low on binary completion is a model that looks good in a demo but fails in production. It does half the job, requiring a human to step in and finish the rest.
How to Read a Benchmark Chart in 3 Steps
So, how do you use these charts without getting fooled?
Step 1: Ignore the Overall Score. Find Your Column. Do you need coding? Look only at the Coding column. Do you need document extraction? Look at the Data Analysis column. Ignore the big composite number at the top.
Step 2: Find the True Cost and Time. Look for charts that show “Cost per Task” (not just price per million tokens). And check the “Time per Task.” A model that is 2% smarter but 10x more expensive and 5x slower is usually the wrong choice. (If you are unsure how to calculate this for your own budget, our article on calculating the real cost of AI. explains the framework)
Step 3: Demand Transparency. Before you trust a chart, ask:
- Is the test set public?
- Who funded this benchmark?
- Did they publish the scores of their competitors, or just their own?
The Bottom Line
Benchmark charts are not scientific documents. They are marketing tools designed to make you buy the newest, most expensive model.
At NeuralRating, we are building benchmarks that are designed differently. We don’t believe in single “magic numbers.” We believe in showing you the real cost per successful task, the time it takes, and the exact failure modes, so you can choose the model that actually fits your workflow, not the one with the prettiest chart.
If you want to follow along, you can join the waitlist on our homepage, read more about our approach, or explore other insights.
Frequently asked questions
What is the Intelligence Index?
The Intelligence Index is a single score created by aggregating the results of several different benchmarks. While useful as a general indicator, it hides the fact that a model might be excellent at coding but poor at reasoning, or vice versa. It creates a false illusion of total superiority.
Why do benchmark charts use a logarithmic scale?
A logarithmic scale is often used to fit models that cost $0.03 next to models that cost $27 onto the same visual chart. However, the downside is that the visual difference between $0.03 and $0.10 looks tiny, hiding the fact that one is more than three times more expensive than the other.
What is 'cherry-picking' in AI benchmarks?
Cherry-picking is when a company highlights a specific benchmark where their model performs best, while ignoring or hiding benchmarks where competitors perform better. A prime example is Meta's Llama 4, which was tuned specifically for a leaderboard, ranking 2nd artificially, but dropped to 32nd when the public version was released.
What is the difference between 'partial' and 'binary' scores?
In benchmarks like OSWorld, a 'partial' score means the AI successfully completed some steps of a task (like opening a file but failing to save it). A 'binary' score is pass/fail: it only counts if the entire task was completed perfectly. A model might score high on partial completion but terrible on binary completion.
How should I choose a model if I can't trust the charts?
Ignore the overall composite score and look only at the specific column that matters for your workflow. Compare the 'Cost per Task' alongside the 'Time per Task'. And most importantly, test the top candidates on your own private data, because no public benchmark knows your specific business needs.